Feels Strategy Tutorial/Starter Guide
Locating Feels Strategy
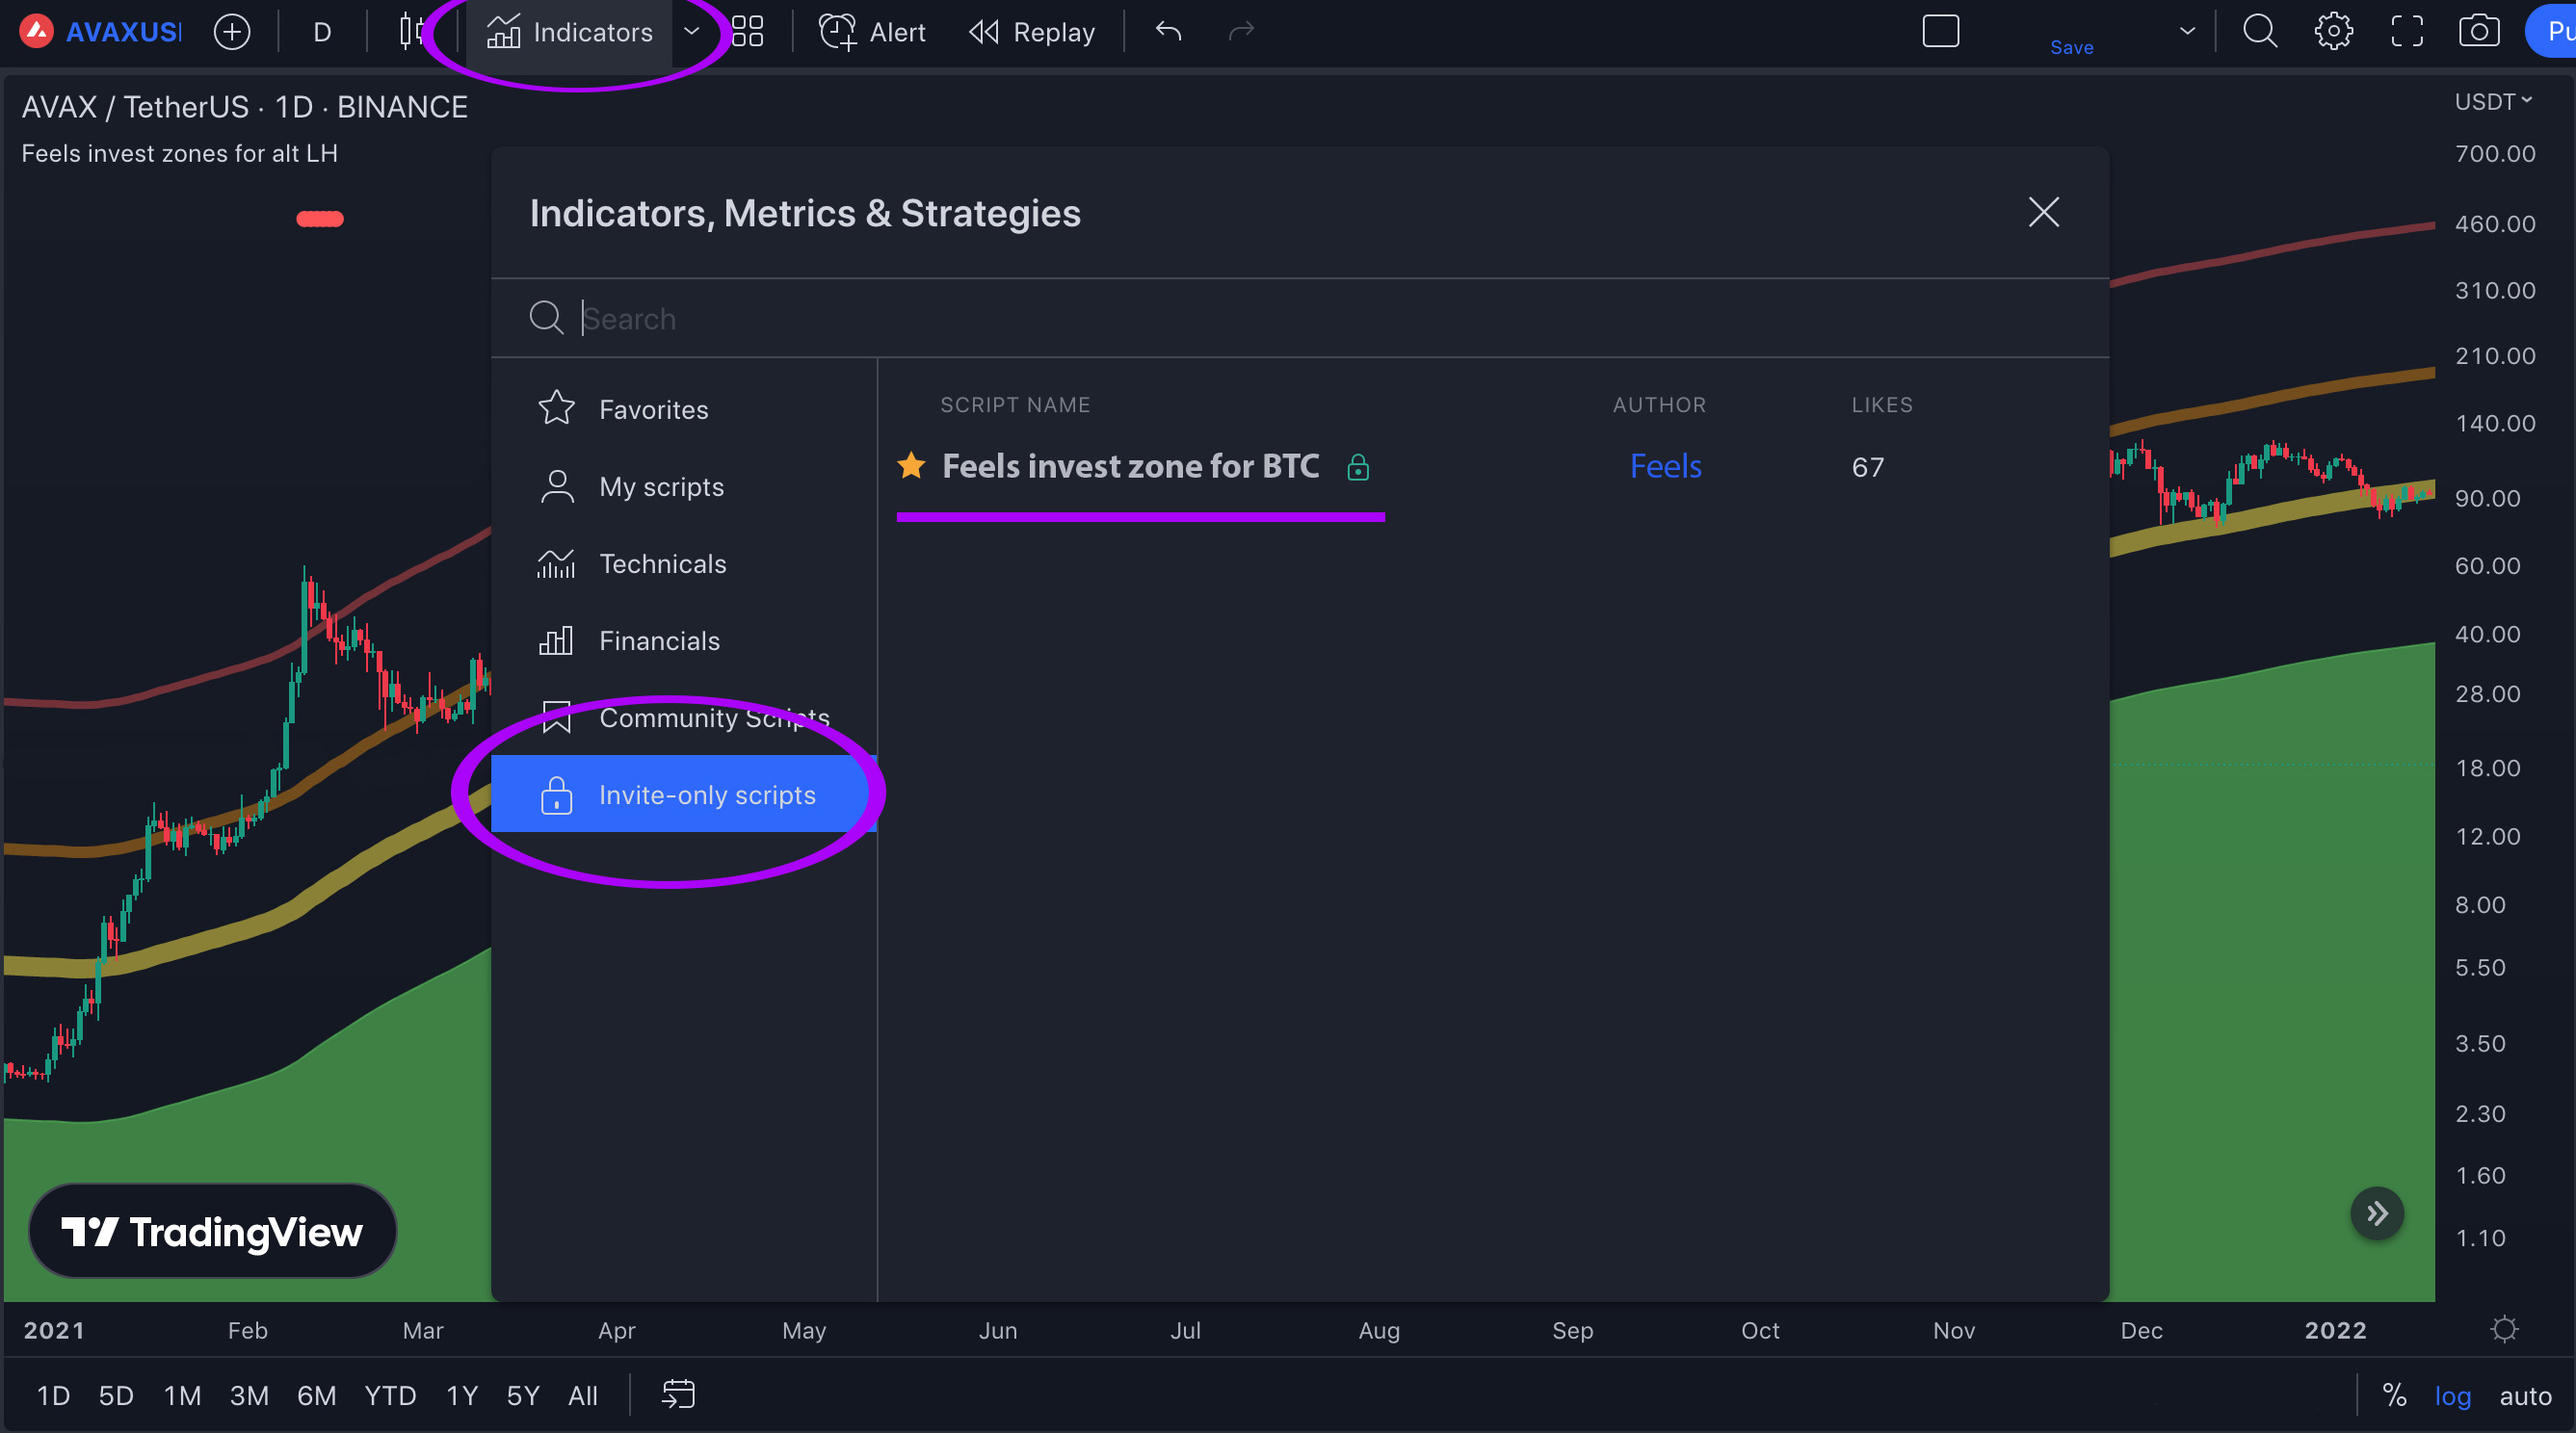
First, you want to go to tradingview.com and launch a chart.
Once you have your chart open, click on the indicators tab --> invite only scripts --> and click on the "Feels Strategy" indicator
Feels Strategy Features
Now that you have the indicator enabled, lets talk about some of the key features that are included in the system.
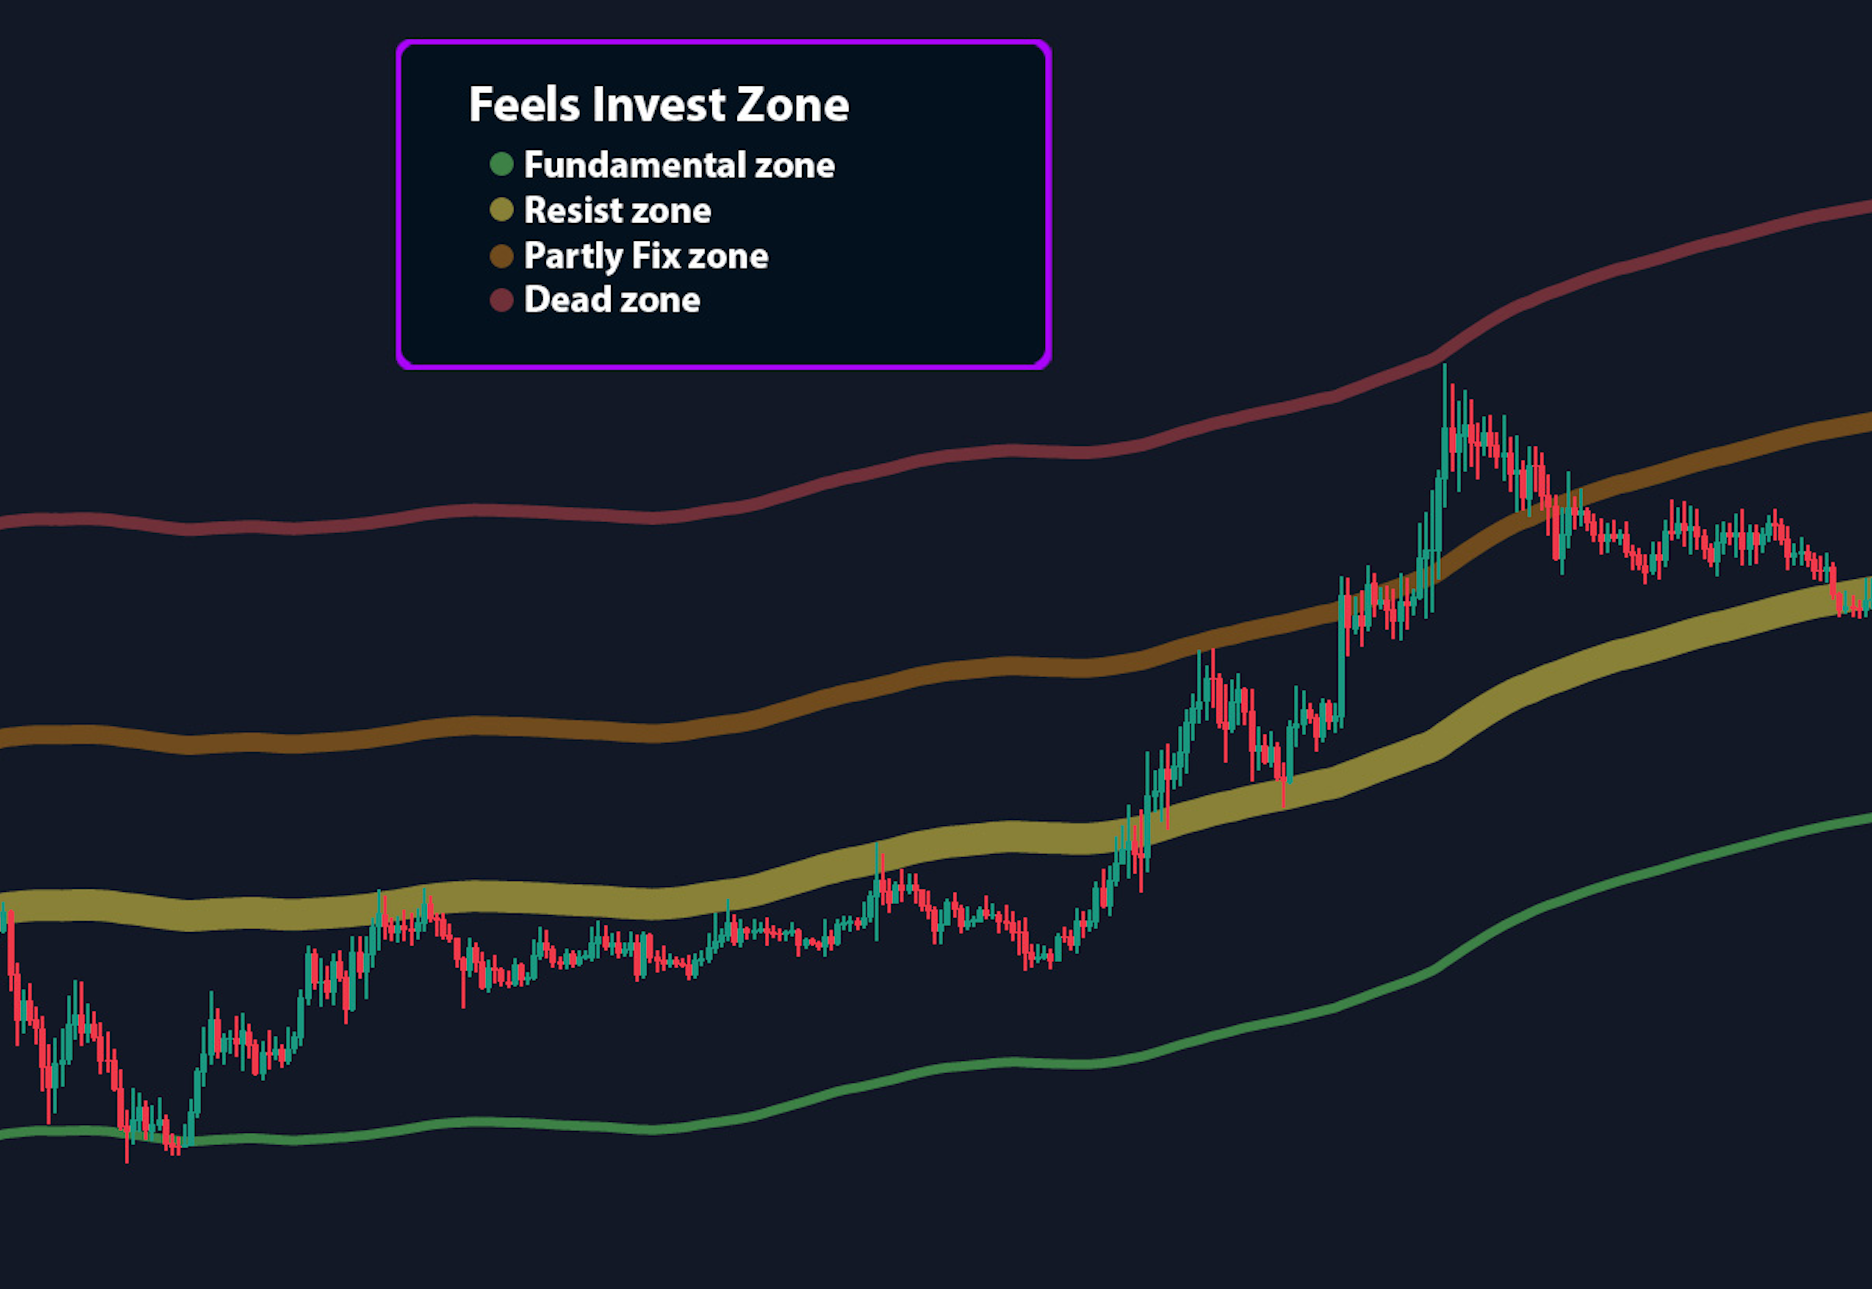
Feels invest zone
The indicator displays the current market sentiment zone and is built on a foundation of fundamental, technical, and social analysis. It operates on the daily timeframe, as the algorithm behind the indicator processes a vast amount of data. This results in a high win rate on coins with at least a year of historical data, but it also works with coins listed on their first day.
How to use invest zone?
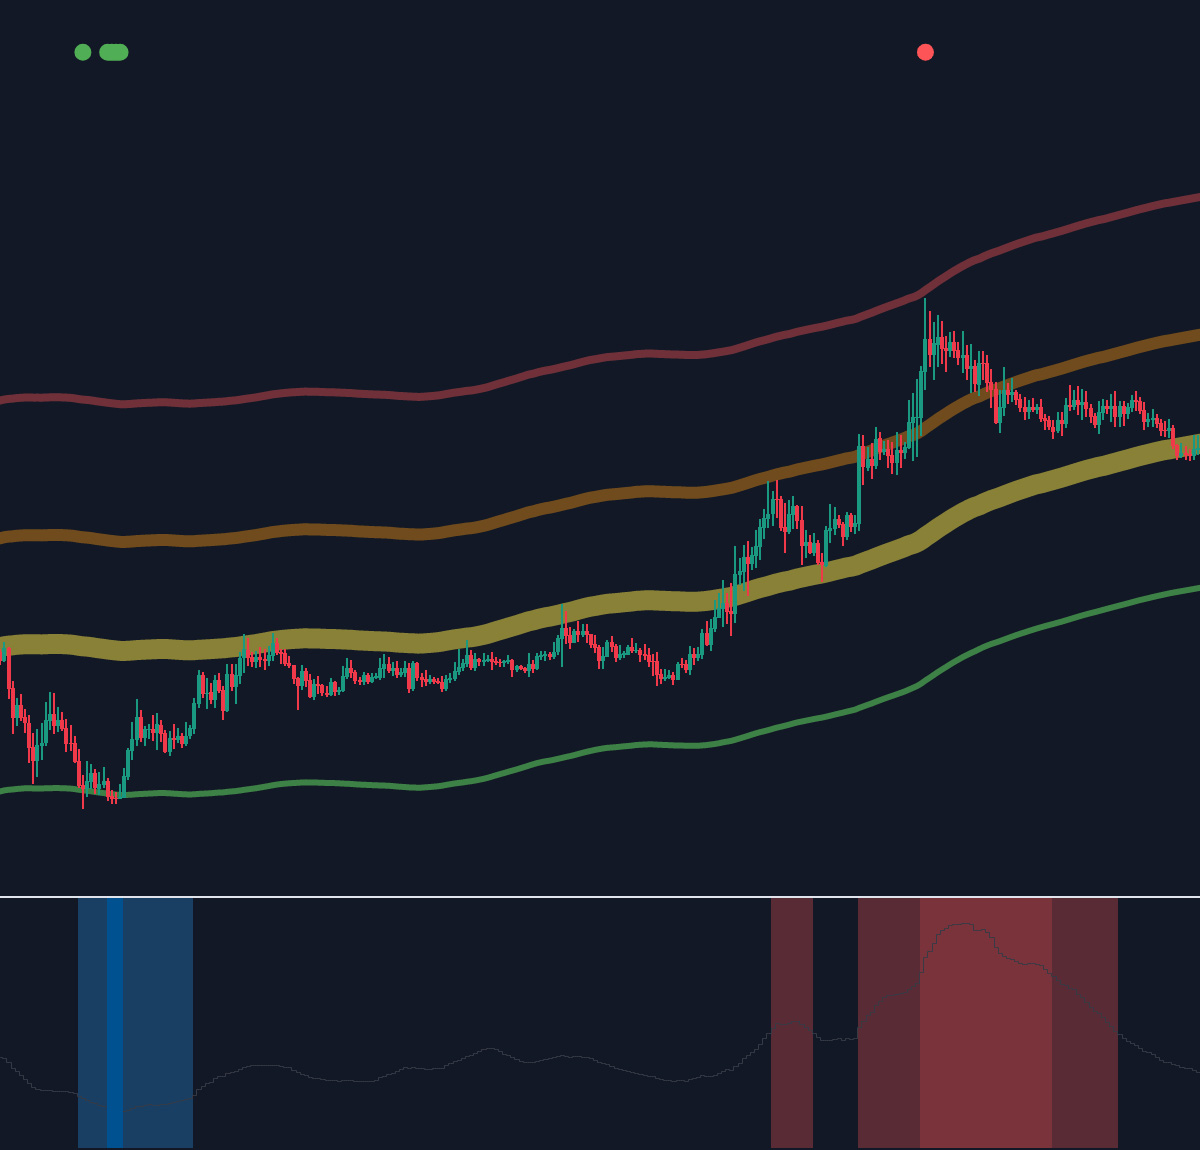
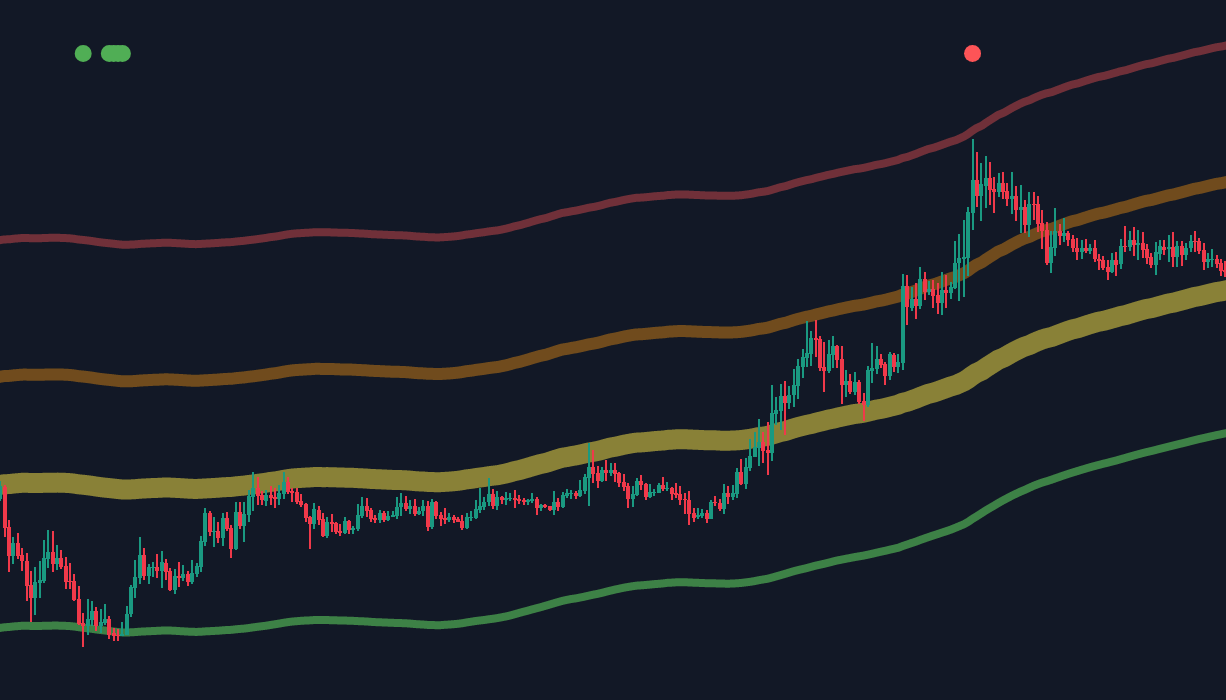
The indicator builds 4 zones which act as support and resistance lines and are updated daily in real-time.
- The fundamental zone is the primary zone to keep an eye on, as it indicates the fair value of the asset when in a normal state. If the asset falls below the green zone, it is undervalued by the algorithm, historically the best time to buy the coin due to the best risk/reward ratio.
- The resistance zone is the main zone of resistance. It is usually difficult for the asset to surpass this zone, and most of the time, the asset is between the green and yellow zones. If the asset does not fall below the green zone or you did not buy during that time, you can still buy when the price is below the yellow resistance zone. However, it is important to understand that the risk/reward ratio is worse in this case.
- The partial fix zone is the first profit-taking zone. When the asset passes the main resistance zone (yellow), it often quickly reaches the orange zone. This gives us the information that it is time to take some profit or exit the investment at break-even (sell some assets to cover the investment).
- The dead zone is the asset's mortal zone. We call it that because there is no life for the asset above this zone. Even if there are cases where it goes above the red zone, it corrects itself and returns to it in the next few days. It is recommended to take profit if not all of your profit, then at least the majority of it.
Upper signals of the Fill-Invest Zones indicator:
- Green: indicates that the asset is below its fundamental value (oversold). After conducting research, if you find the asset attractive, it is a signal to buy.
- Red: indicates that the asset is strongly overbought. It is necessary to fix your profits.
- There is also an orange signal (turn on in the settings), which indicates that the asset is somewhat overbought, and it is time to consider partial profit-taking."
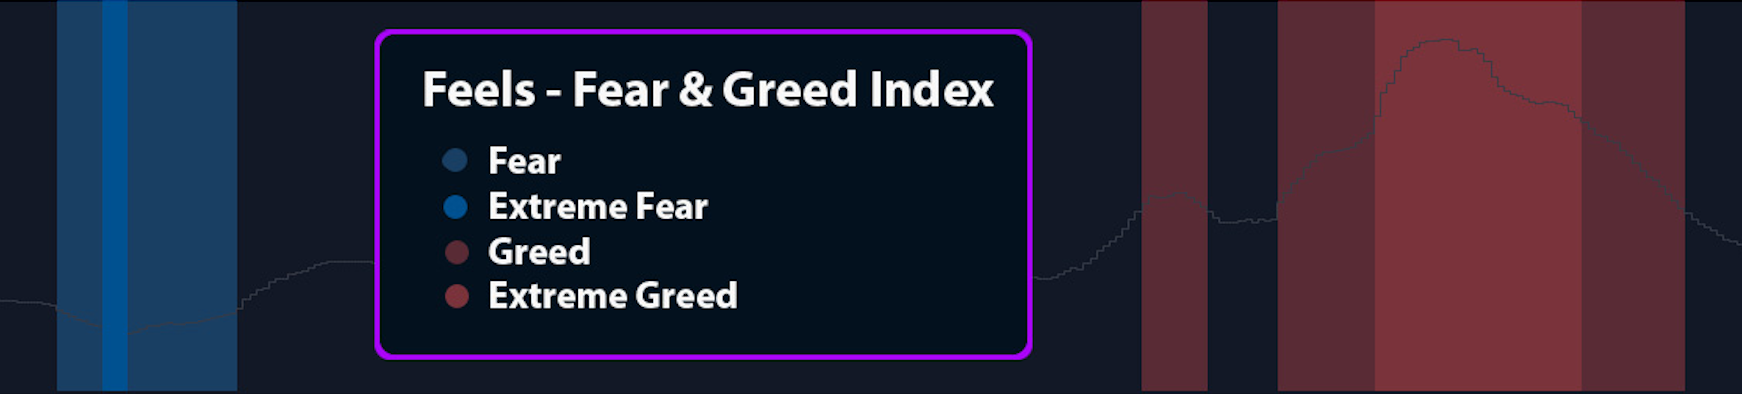
Feels Fear & Greed Index
"The Fear & Greed Index is an indicator that assesses the social analysis of cryptocurrencies. It's best used in combination with the Feel Invest Zone on a daily timeframe. Fear in the market leads to irrational actions, as investors sell their assets due to a fear of future price drops, which causes a price drop without any serious reason. When people's greed takes over with FOMO(Fear of missing out), and they buy assets that are already overbought, it leads to even higher asset prices.
So, what does social analysis tell us about the market?
- Blue - background. Fear is a good time to buy.
- Bluer - background. Extreme fear is the best time to buy.
- Red - background. Greed is a good time to sell.
- Redder - background. Extreme greed is the worst time to sell an asset.
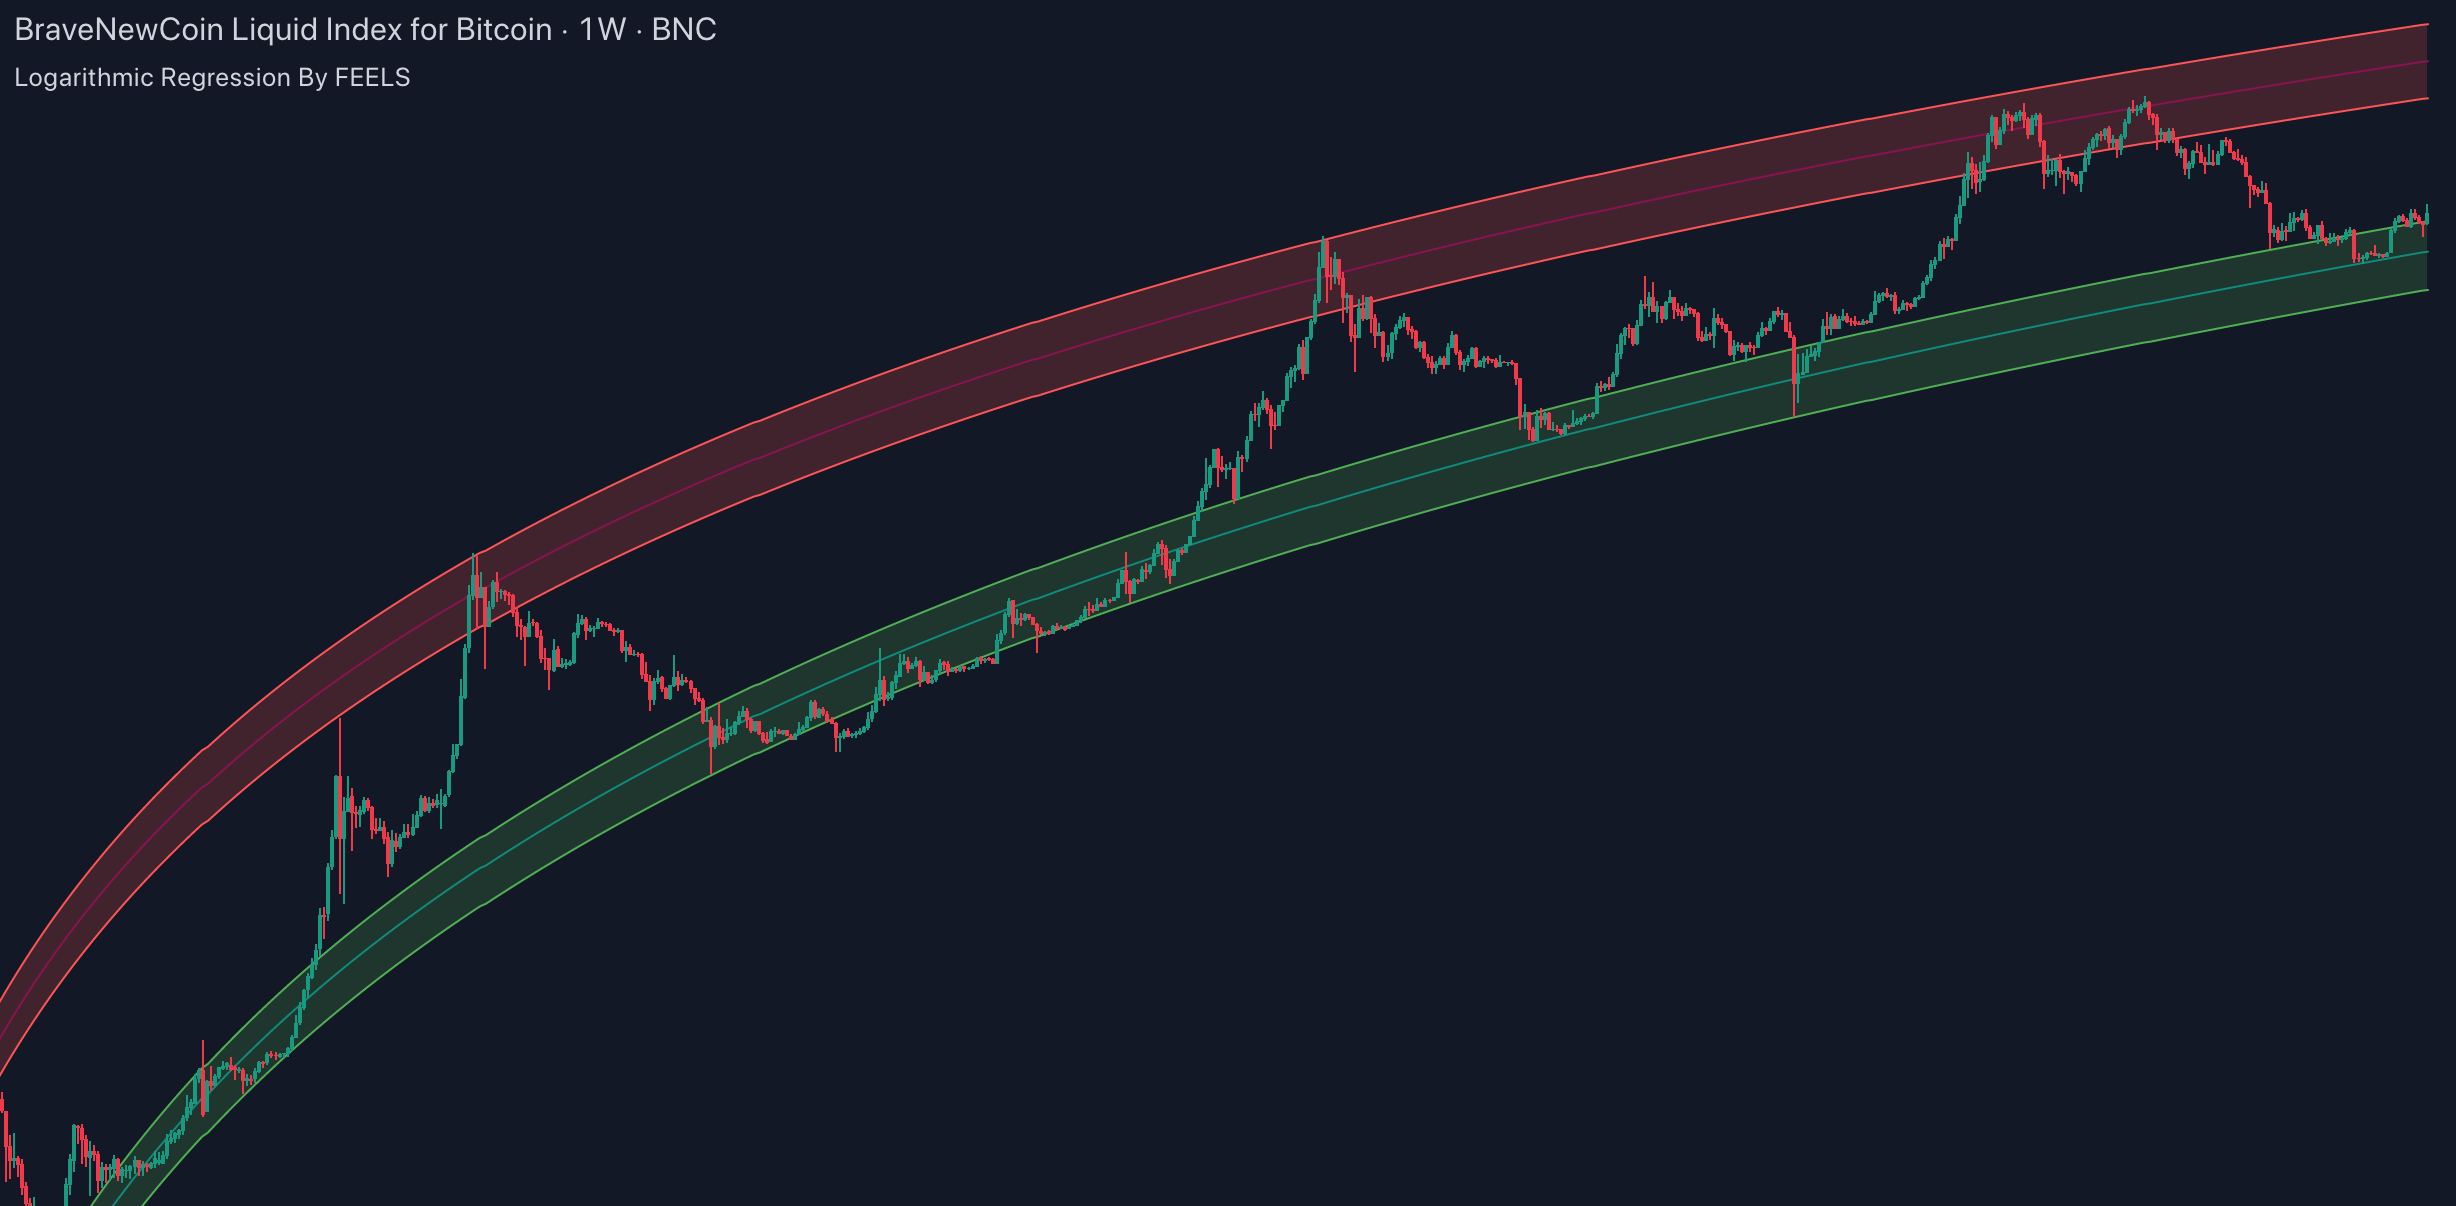
Logarithmic regression channel
Investors use the logarithmic regression channel to identify potential buy and sell signals. When the price moves towards the upper resistance line, it may indicate an overbought market and a potential sell signal. Conversely, when the price moves towards the lower support line, it may indicate an oversold market and a potential buy signal.
The logarithmic regression channel can also be used to set price targets or stop-loss orders, as the lines provide an indication of where the price may find support or resistance. Additionally, it can help traders identify the current trend of the market, whether it is bullish or bearish.
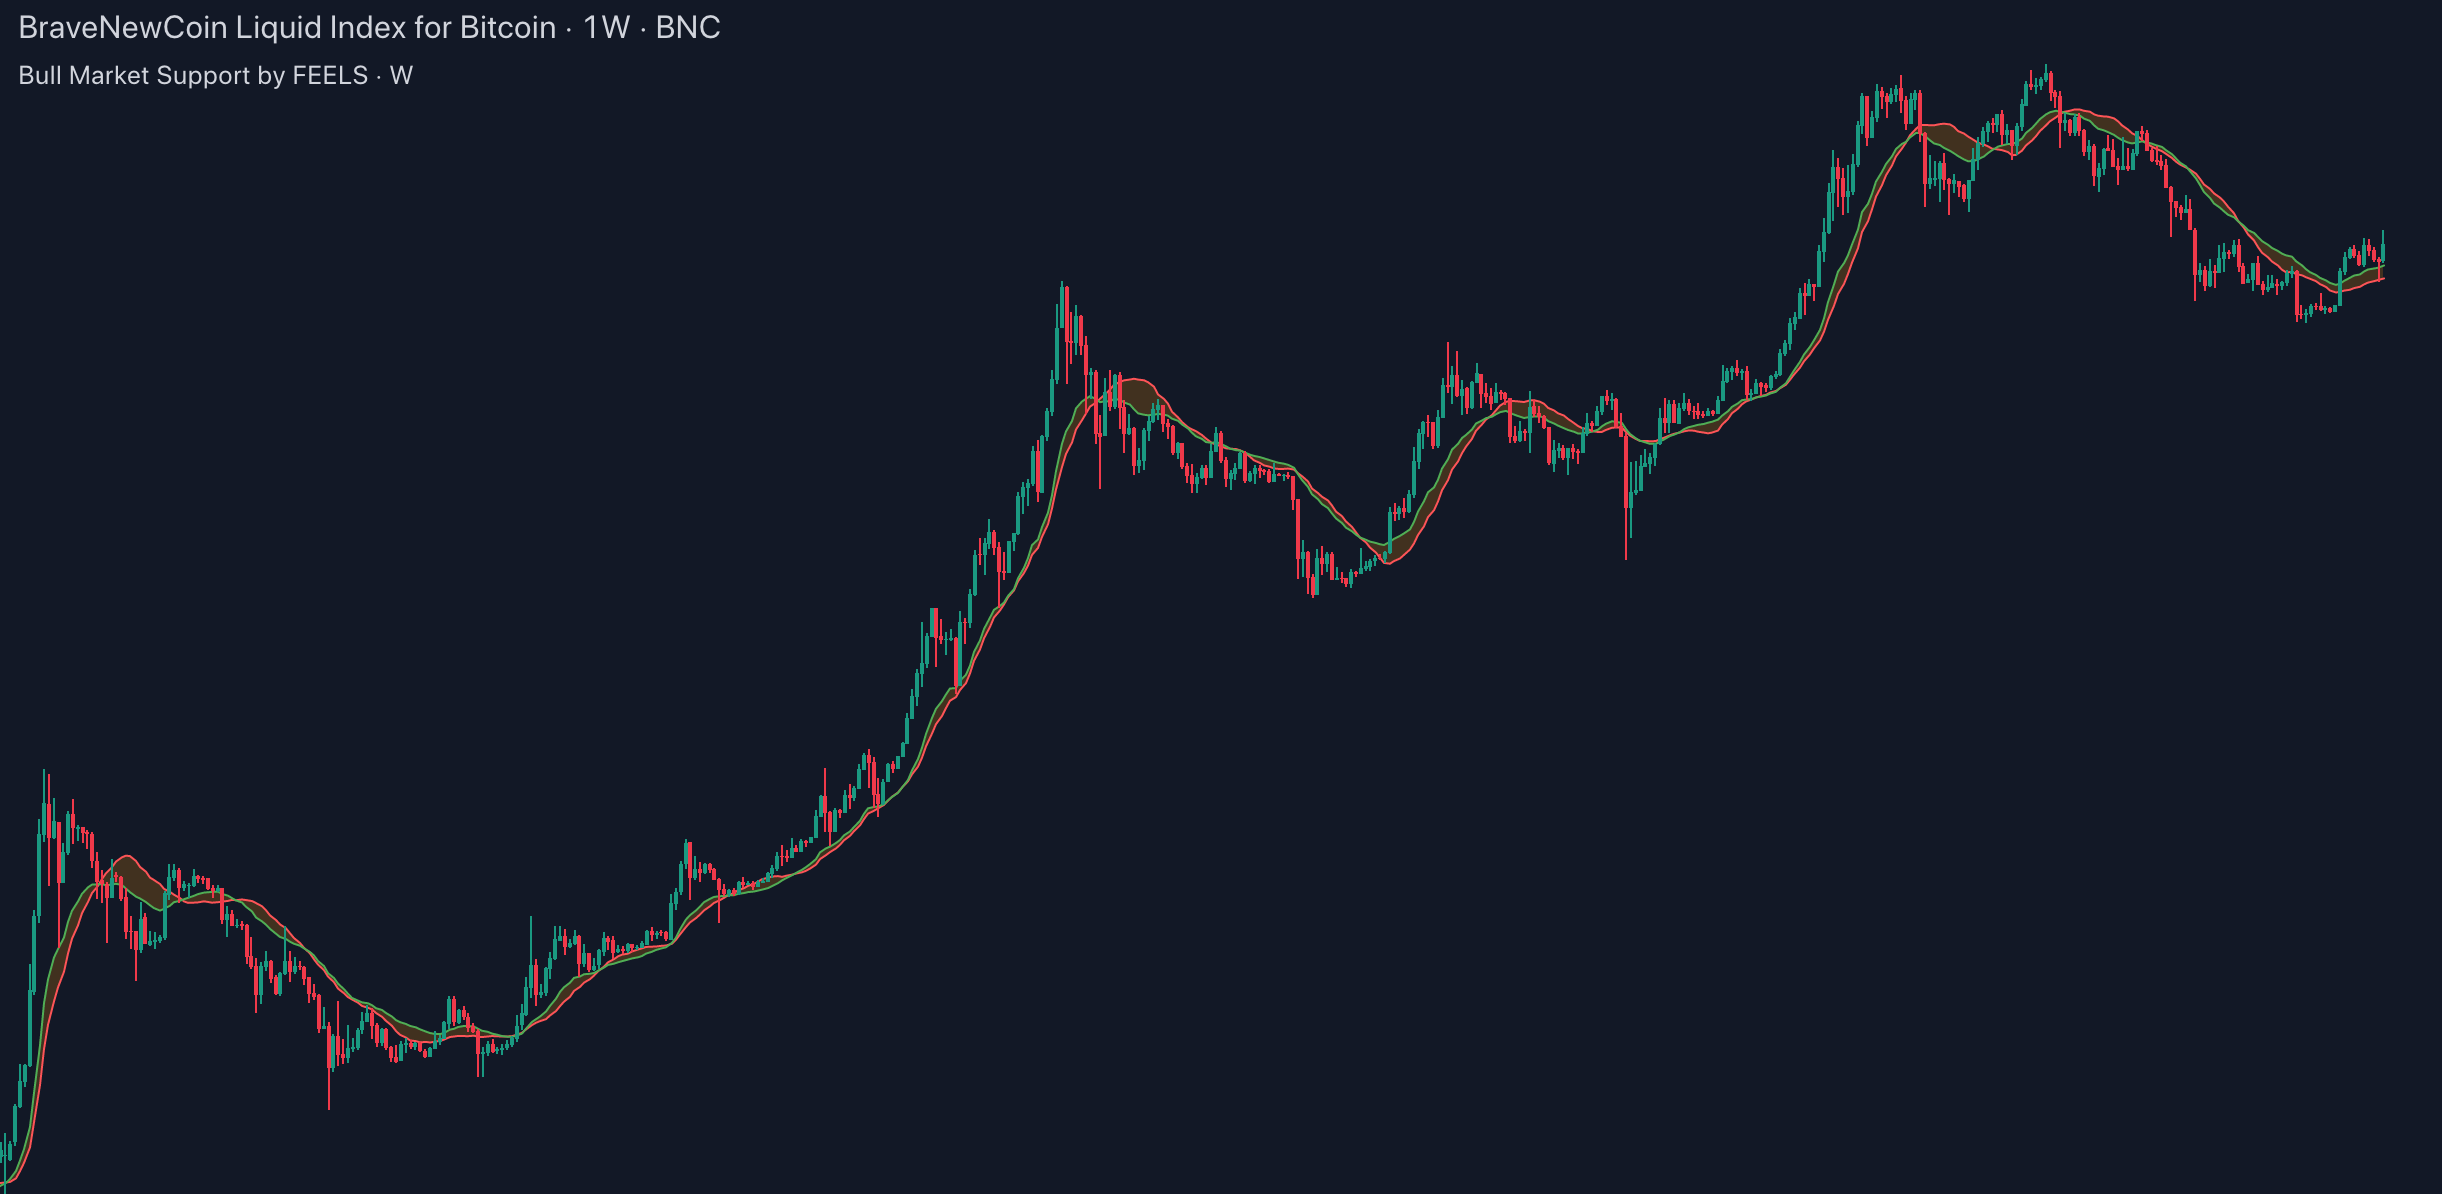
The Bull Market Support Band
The Bull Market Support Band is a type of support and resistance line that is designed to help traders identify potential entry and exit points during a bull market.
Traders can use the Bull Market Support Band to identify potential buying opportunities when the price of Bitcoin approaches the lower support line. This is because the support line is expected to provide a level of support that could potentially push the price back up.
It is important to note that the Bull Market Support Band is not a guarantee of future price movements and should be used in combination with other technical and fundamental analysis tools to make informed trading decisions.
Other indicators
We also have many additional indicators that are currently in beta testing or development. If you have specific preferences or you're inspired by someone's idea, feel free to share your strategy with us. We can work together to create a similar indicator that you can be the first to test.
We value feedback from our users and are committed to constantly improving our tools to meet your needs. Don't hesitate to let us know what you'd like to see in future updates. With your help, we can build a community that supports and empowers each other to make better trading decisions.